BioDOE Logo
BioDOE
Biological Design of Experiments
Active Experiment Summary & Reports Help & Guidance
Recent Projects
Experiment > Untitled Experiment

Untitled Biological Experiment

Click to Rename

Starter Free
AP
Dr. Alisha Patel
Lead Bioprocess Scientist
BioDOE Brand Logo
BioDOE
Biological Design of Experiments
Features Solutions Pricing Resources
Purpose-Built for Biologists & Bioprocess Engineers

BioDOE: Design Smarter Biological Experiments, Accelerate Discovery Faster.

Stop guessing with wasteful One-Factor-at-a-Time (OFAT) trials. BioDOE provides an intuitive 3-Panel Design Studio for assays, bioprocessing, formulations, and multi-response surface optimization without requiring a PhD in statistics.

No Install Required Real ANOVA, No Guesswork Handles Hard-to-Change Factors
Pareto Optimization
Desirability: 0.942 ✨
Split-Plot Bioreactors
Whole-Plot Grouped 🔒
app.biodoe.io/studio
CHO Cell Culture Optimization REML Active
1. Factors & Responses
• Temp (33 - 37 °C) 🔒 WP
• Glucose (2 - 8 g/L)
• Media (RPMI / DMEM)
2. Split-Plot Matrix
Run 1: WP_1 (33°C, 2g/L)
Run 2: WP_1 (33°C, 8g/L)
Run 3: WP_2 (37°C, 2g/L)
3. 3D Surface & ANOVA
$R^2 = 0.962$ ($p < 0.001$)
Opt: 35.2°C, 6.4g/L
Yield: 4.82 g/L

Built for Biological Complexity

From high-throughput screening and formulation buffers to equipment constraints in bioprocessing suites.

1. Biological Factor Setup

Specify 2-level continuous ranges (pH, Substrate Concentration) and discrete multi-option choices (Media Types, Enzyme Strains, Buffer Components).

Explore Factor Setup

2. Hard-to-Change Factors

Flag settings that are slow or expensive to change — like incubation temperature or which bioreactor vessel you're using — so the design groups runs together instead of resetting equipment between every single run.

Explore Hard-to-Change Support

3. Balance Competing Goals

Automatically finds the best settings when your goals pull in different directions — for example, maximizing yield while minimizing impurity — instead of you weighing the tradeoffs by hand.

Explore 3D Surface Mesh
Tailored Life Science Solutions

Accelerating Discovery Across Every Assay & Bioprocess

Whether optimizing CHO cell culture, Immunoassay Development (ELISA & Potency Assays), or formulation stability, BioDOE reduces experimental runs by up to 75%.

CHO Cell Culture Media Optimization

Simultaneously evaluate Glucose, Amino Acid Feeds, and Temperature Shift timing to boost monoclonal antibody titers while maintaining 95%+ cell viability.

Bioprocess Case Study
Assay Developers

Immunoassay & Bioassay Development

Optimize ELISA, HTRF, and Cell-Based Potency Assays. Simultaneously screen antibody coating levels, detection conjugate dilutions, blocking agents, and incubation times to maximize signal-to-noise (S/N) ratio and dynamic range.

Immunoassay Optimization

Recombinant Protein & Enzyme Expression

Screen induction timing, IPTG/Methanol concentration, and Dissolved Oxygen levels. Account for hard-to-change incubator temps via Split-Plot designs.

Expression Workflow

Assay Buffer & Formulation Stability

Formulate high-stability biologics. Optimize pH, ionic strength, surfactants, and cryoprotectants to prevent aggregation through freeze-thaw cycles.

Formulation Matrix

Gene Therapy & Viral Vector Transfection

Optimize AAV or Lentivirus production by balancing plasmid ratios, transfection reagent concentrations, and harvest timing for maximum viral titer.

Gene Therapy Solutions

Dr. Alisha Patel

"BioDOE transformed our CHO cell culture media optimization. In just 12 runs, we identified critical Glucose and Temperature interactions that we had spent 6 months trying to find with traditional OFAT experiments. A total game-changer for bioprocess development."

Dr. Alisha Patel, PhD • Lead Bioprocess Scientist, BioTech Innovators
Transparent Life Science Pricing

Simple Plans Built for Every Stage of Research

Start free, upgrade as your experimental volume grows. No expensive desktop licenses required.

Starter Scientist
For getting started & light experimentation
$0 / month forever
  • 3 Designs + 3 Analyses / Month
  • Screening & Mapping Designs (Find What Matters / Map the Shape)
  • Full Statistical Analysis (ANOVA, Pareto, Actual vs. Predicted)
  • CSV Import/Export & PNG/SVG Figure Export
  • Secure Sign-In
Recommended for Labs
Pro Scientist
For active research & unlimited experimentation
$49 / month
Everything in Starter, plus:
  • Unlimited Designs & Analyses
  • Optimization Designs (Find the Peak)
  • Hard-to-Change Factor Support
  • Multi-Goal Optimization (Optimal Settings Recommendation)
  • 3D Surface & Contour Plots

Ready to Transform Your Biological Optimization?

Join leading life scientists, bioprocess engineers, and biotech researchers using BioDOE to design, execute, and optimize multi-factor experiments in minutes.

1. Define Factors & Responses

What are you trying to do?

Screening uses a small fractional-factorial design (Resolution IV) to isolate the vital few factors cheaply.

Biological factors
Factor Name Values / Range
Add New Biological Factor
Numerical DOE uses Low & High boundaries.
+ Add Factor
Measured Responses

Responses are added after you generate your design — see the "2 · Design of Experiment" tab.

Group Your Runs (optional)

If some runs will happen on a different day, batch, or plate than others, name that here so the analysis can account for it separately from your real factors.

Reliability Check (optional)

Tell us how noisy your assay normally is and how small a change still matters, and we'll check whether this design has enough runs to actually detect it.

2. Design of Experiment

Measured Responses
#

3. Data Analysis

3D Response Surface Plot
vs
Pareto Chart of Effects
Run analysis to generate Pareto chart
Actual vs. Predicted
Run analysis to check model fit
Factor p-value Sig

Experiment Setup

  • 1 Scientific Goal
  • 2 Experimental Dials
  • 3 Responses
  • 4 Reliability Check

Define Your Goal

What are you trying to achieve with this experiment?

Add Experimental Dials (Factors)

Define physical input variables and their operational boundaries.

Numerical factors use 2 levels (Low & High). Midpoints (center points) are added automatically.

Define Measured Responses

What outcomes are you measuring?

Design Summary & Reliability Check

Review your design setup and statistical detection power before generating your experiment table.

Experiment Overview

Design Type: Screening (Resolution IV)
Total Factors: 0
Total Responses: 0
Calculated Lab Runs
12
Total Experimental Conditions

Statistical Detection Power

With 12 runs, your design has >80% statistical power to detect signal changes equal to 2x your assay background noise level (SNR ≥ 2.0).

Experimental Summary Report

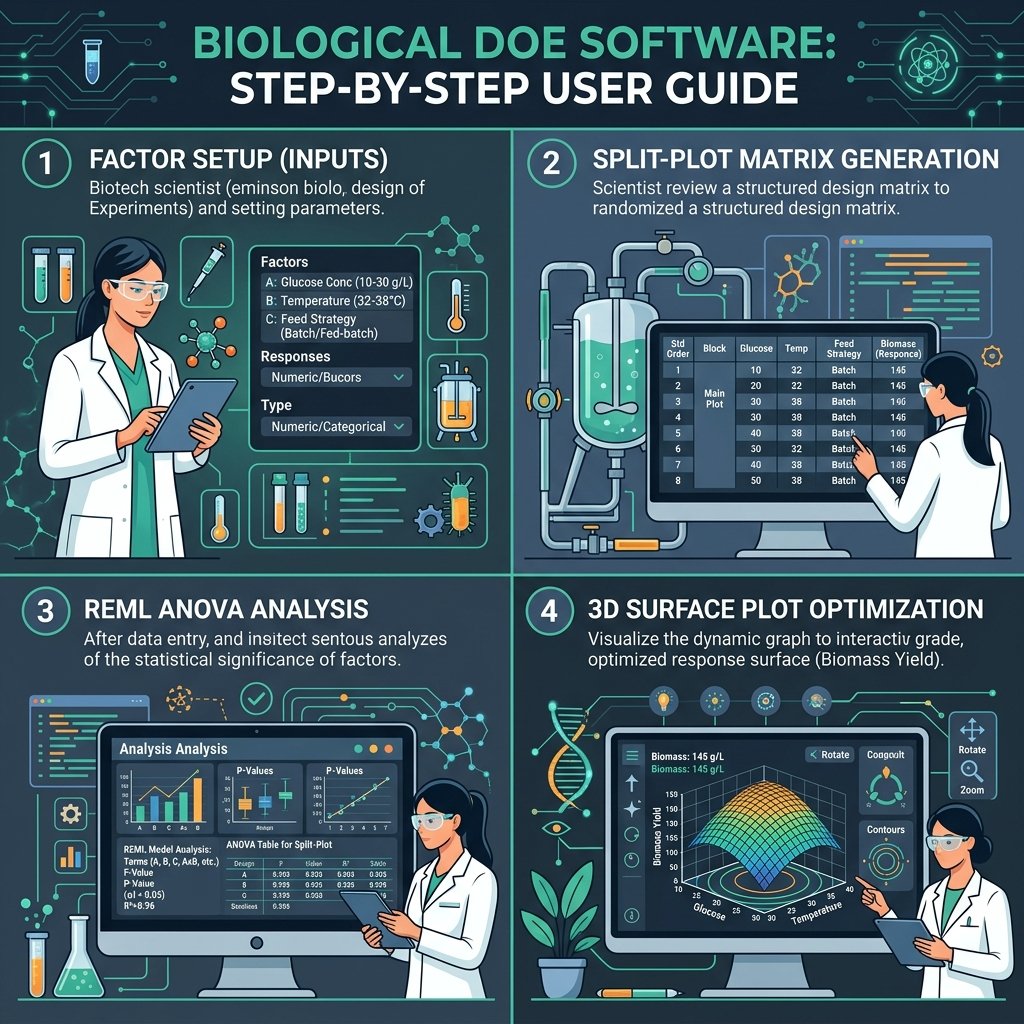
BioDOE Step-by-Step User Guide

A Biologist's Quick Reference for Multivariable DOE
BioDOE Step-by-Step Workflow

BioDOE Workflow in 5 Minutes: Define Biological Factors $\rightarrow$ Select Design Matrix $\rightarrow$ Execute Lab Runs & Input Results $\rightarrow$ Run REML ANOVA $\rightarrow$ Export Publication 3D Figures.

1

Define Biological Factors & Responses

Add numerical factors (e.g. Glucose [5–25 g/L], Temperature [33–37 °C]) or categorical variables (e.g. Feed Strategy A vs B).

Bioreactor Constraints: Mark Temperature as Hard to Change to automatically generate a cost-effective Split-Plot design!
2

Generate Design Matrix (Screening vs Characterization)

  • Fractional Factorial / Screening: Reduces 32 runs down to 8 or 12 runs to quickly screen out inactive media components.
  • Characterization (Center Points): Adds replicate center runs to test for non-linear curvature in your assay response.
3

Execute Experiment & Enter Results

Run your lab assays according to the randomized run order. Enter measured values (e.g. Titer [g/L] or Viability [%]) directly into the interactive grid or click Import CSV.

4

Run REML ANOVA & Explore 3D Surface Plots

Click Analyze Experiment to calculate statistical main effects, $p$-values, model $R^2$, and multi-objective Derringer-Suich desirability.

Rotate the interactive 3D surface plot to pinpoint peak yield coordinates!
5

Export Publication Figures & Data Reports

Click Export High-Res PNG or Vector SVG for paper figures, or click Print Full DOE Audit Report for PDF archiving.

BioDOE Sign In

OR
Forgot password?

Enter your work email and we'll send you a link to reset your password.

← Back to Sign In

Choose a new password for your BioDOE account.

Choose Your BioDOE Plan

Welcome to BioDOE! Upgrade to Pro Scientist for unlimited experimental designs, REML ANOVA analysis, and publication figure exports!

Recommended for Labs
Pro Scientist Plan
Unlimited Split-Plot DOE & REML ANOVA
$49/mo
Cancel anytime
  • Unlimited DOE Design Generation (Split-plot, Fractional Factorial)
  • Unlimited REML MixedLM Analysis (Statistical significance & $R^2$)
  • Derringer-Suich Multi-Objective Desirability
  • High-Res 3D Surface Plots & Vector SVG Exports

CSV File Format Specifications & Examples

Supported format for importing factor variables & lab assay matrices

1. Factor Setup CSV Format

Download Factor Template (.csv)

Headers required: Factor Name, Type, Low Level, High Level, Unit, Hard To Change

Factor Name Type Low Level High Level Unit Hard To Change
Glucose Concentration Continuous 5 25 g/L No
Temperature Continuous 33 37 °C Yes
Feed Strategy Categorical Feed A Feed B - No

2. Full Run Matrix & Response Results CSV Format

Download Matrix Template (.csv)

Includes factor run levels and measured assay responses (e.g., Titer, Viability):

Run Glucose (g/L) Temp (°C) Feed Strategy Titer (g/L) Viability (%)
1 5 33 Feed A 2.1 88.4
2 25 33 Feed A 3.8 92.1